Political Analysis
Project case study
May 20, 2024
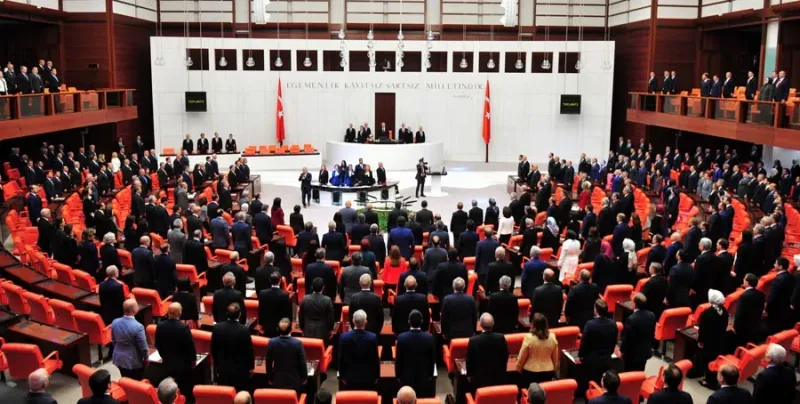
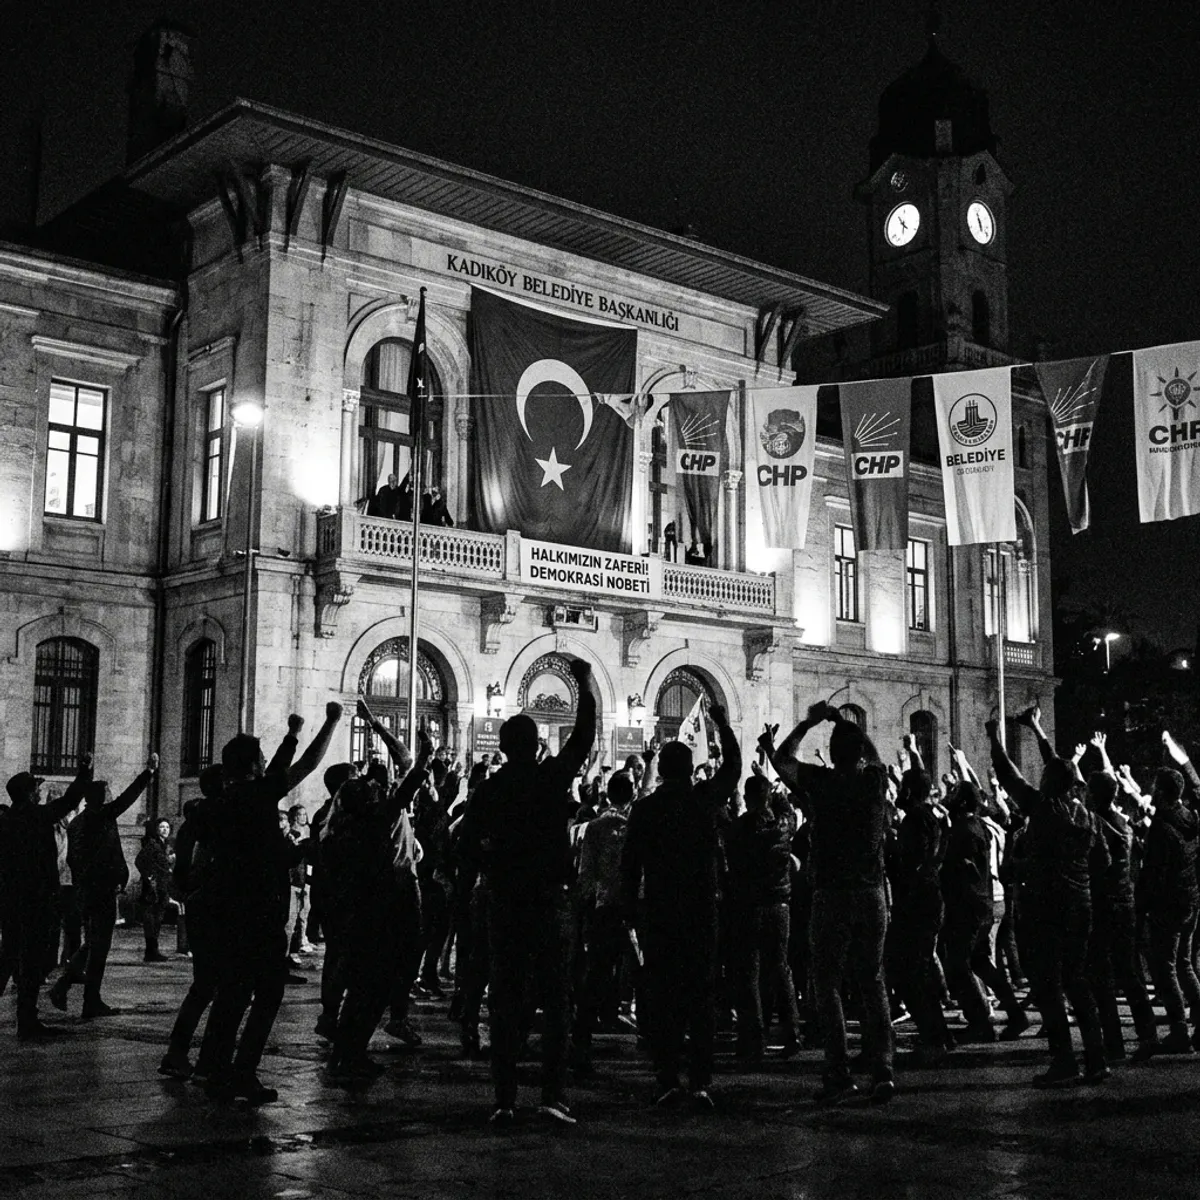
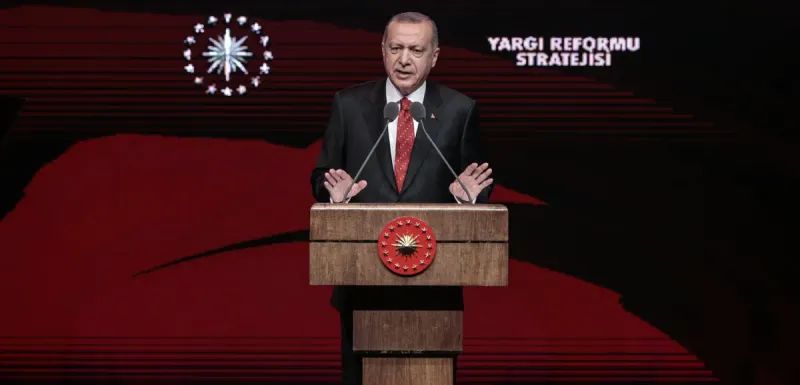
Crackdown on CHP
An interactive investigation documenting judicial and political pressure on Turkey's main opposition party.
Role: Research, data analysis, narrative structure, visual presentation
Impact: Packs a politically sensitive story into a transparent, evidence-led format.
D3.js JavaScript Data Visualization Political Reporting